EOG Test: The Arden Ratio and What It Tells You
What the EOG measures
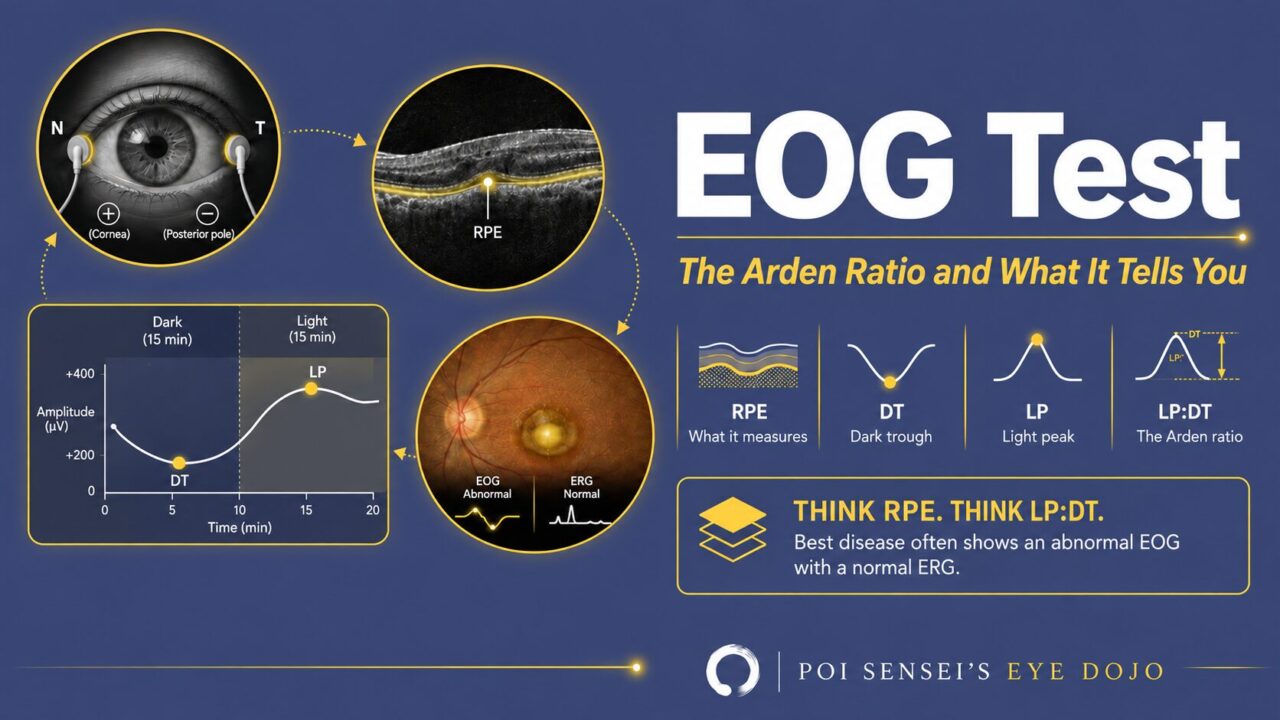
The electro-oculogram (EOG) is the one test in routine use that reports on the function of the retinal pigment epithelium. The international standard describes it as "an electrophysiological test of the outer retina and retinal pigment epithelium (RPE) in which changes in the electrical potential across the RPE are recorded"[1].
Written out in full, the electrophysiology puts most readers off, so here is the working version.
The two facts you need first
To follow how the test works, two things have to be in place. Take them as given and memorize them.
First, across the retinal pigment epithelium: when the retina receives light, hyperpolarization and depolarization occur, and the result is that the vitreous side of the RPE becomes positive and the choroidal side negative.
Second, across the eye as a whole: the corneal side is positive and the optic nerve side is negative. The eye behaves like a dipole with the cornea at the positive pole.
How the test is performed
Electrodes are placed on both sides of each eye, one nasal and one temporal. Take the temporal electrode as positive.
- When the eye looks toward the temporal side, a positive deflection appears.
- When the eye looks the other way, a negative deflection appears.
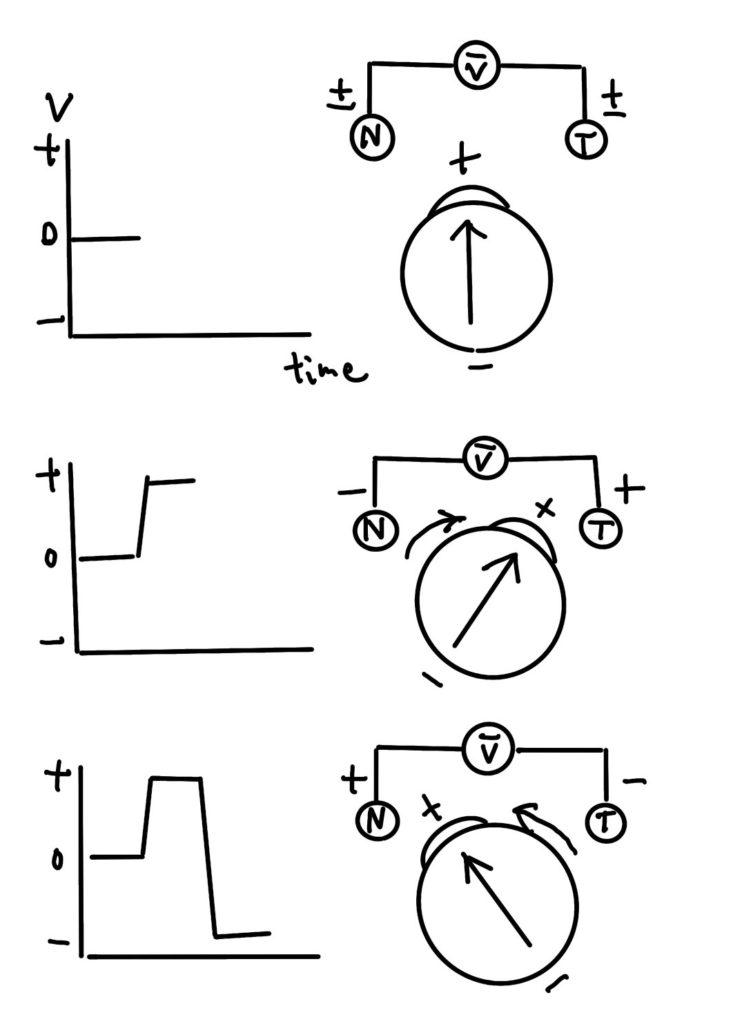
The patient is asked to look right, left, right, left at a steady rhythm until the trace is stable, and the average amplitude over roughly a minute is recorded and plotted.
That sequence is repeated through the two phases of the test. The standard uses 15 minutes of dark adaptation followed by 15 minutes of light adaptation[1].
Reading the result
Plot the averaged amplitudes and you get the curve the test is named for.
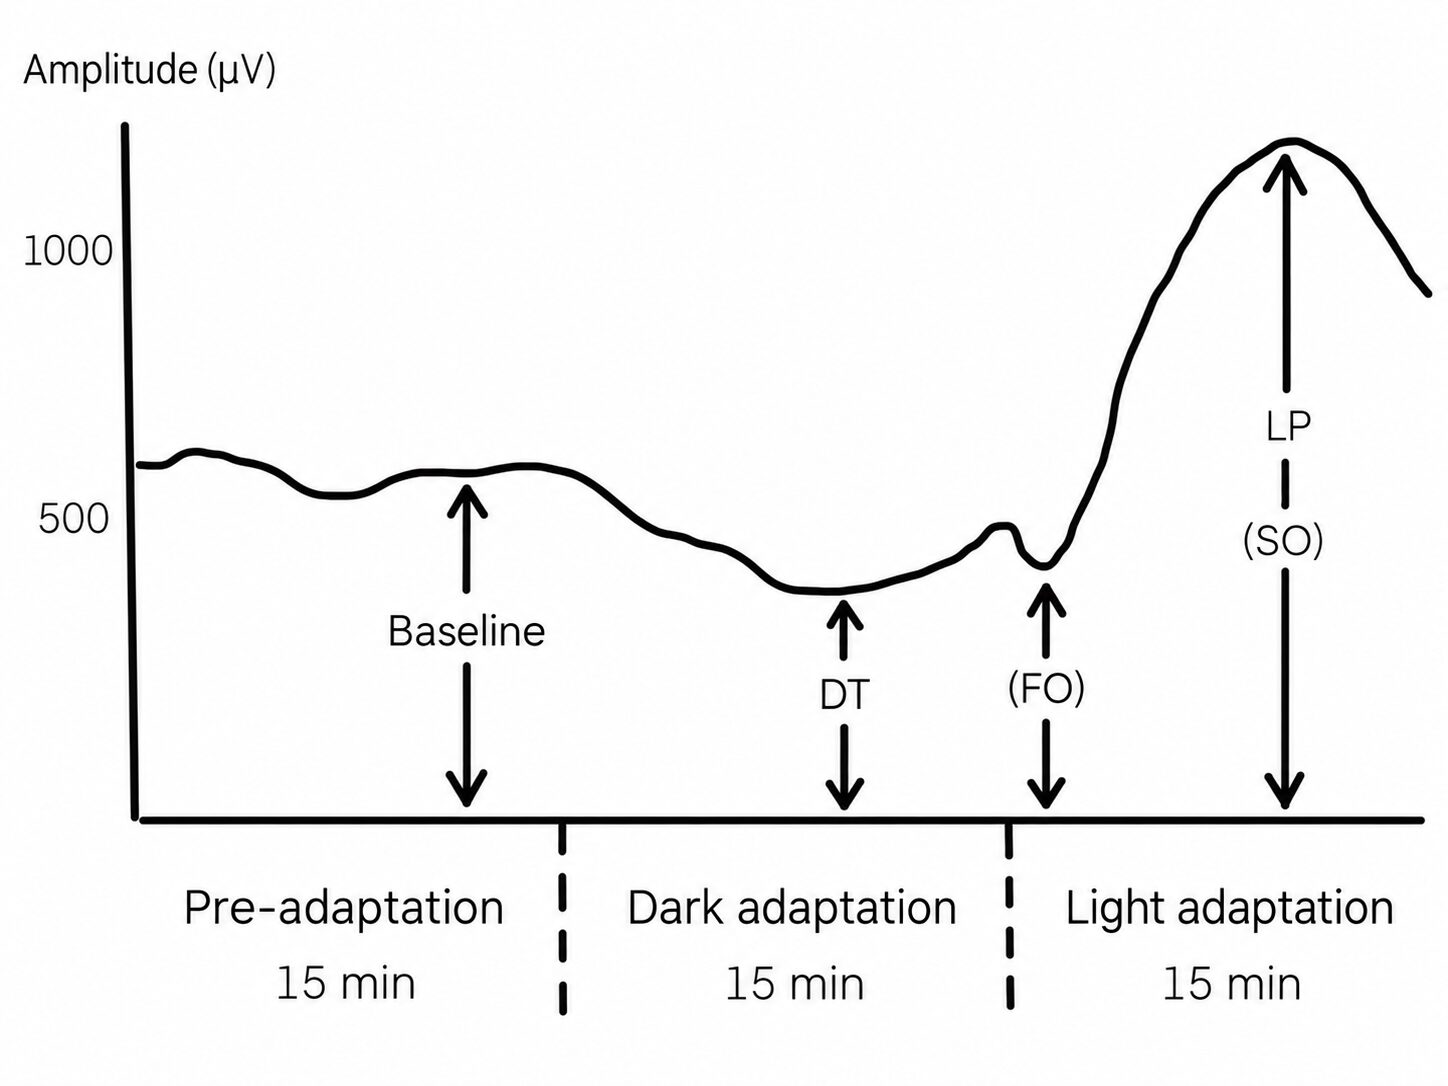
Recording starts under room light, and that amplitude is the baseline. With the lights off, the amplitude falls steadily and reaches its lowest point, the dark trough (DT), at 10 to 15 minutes[1]. Then the lights come up, the amplitude climbs, and reaches its maximum, the light peak (LP), 7 to 12 minutes after light onset[1].
The result is the ratio of those two numbers.
- Find the dark trough: the lowest amplitude during dark adaptation.
- Find the light peak: the highest amplitude during light adaptation.
- Divide LP by DT. That ratio is the result.
This LP:DT ratio is the number classically called the Arden ratio. The international standard has retired that name: it records that "the main clinical measure (the Arden ratio)" is "now termed the light peak:dark trough ratio"[1]. Both names refer to the same calculation, and you will meet both.
Which diseases show an abnormal EOG
Diseases that damage the retinal pigment epithelium over a wide area, retinitis pigmentosa for instance, reduce the ratio.
But that is not where the test earns its keep. When the RPE is damaged that widely, a fundus photograph or an OCT shows it at a glance, and you do not need a 30-minute recording to tell you so.
Where the EOG is genuinely useful is vitelliform macular dystrophy (Best disease) and autosomal recessive bestrophinopathy. In these, the abnormality is in bestrophin, which is involved in the RPE’s chloride handling and therefore in the depolarization that the EOG samples. So the EOG is abnormal.
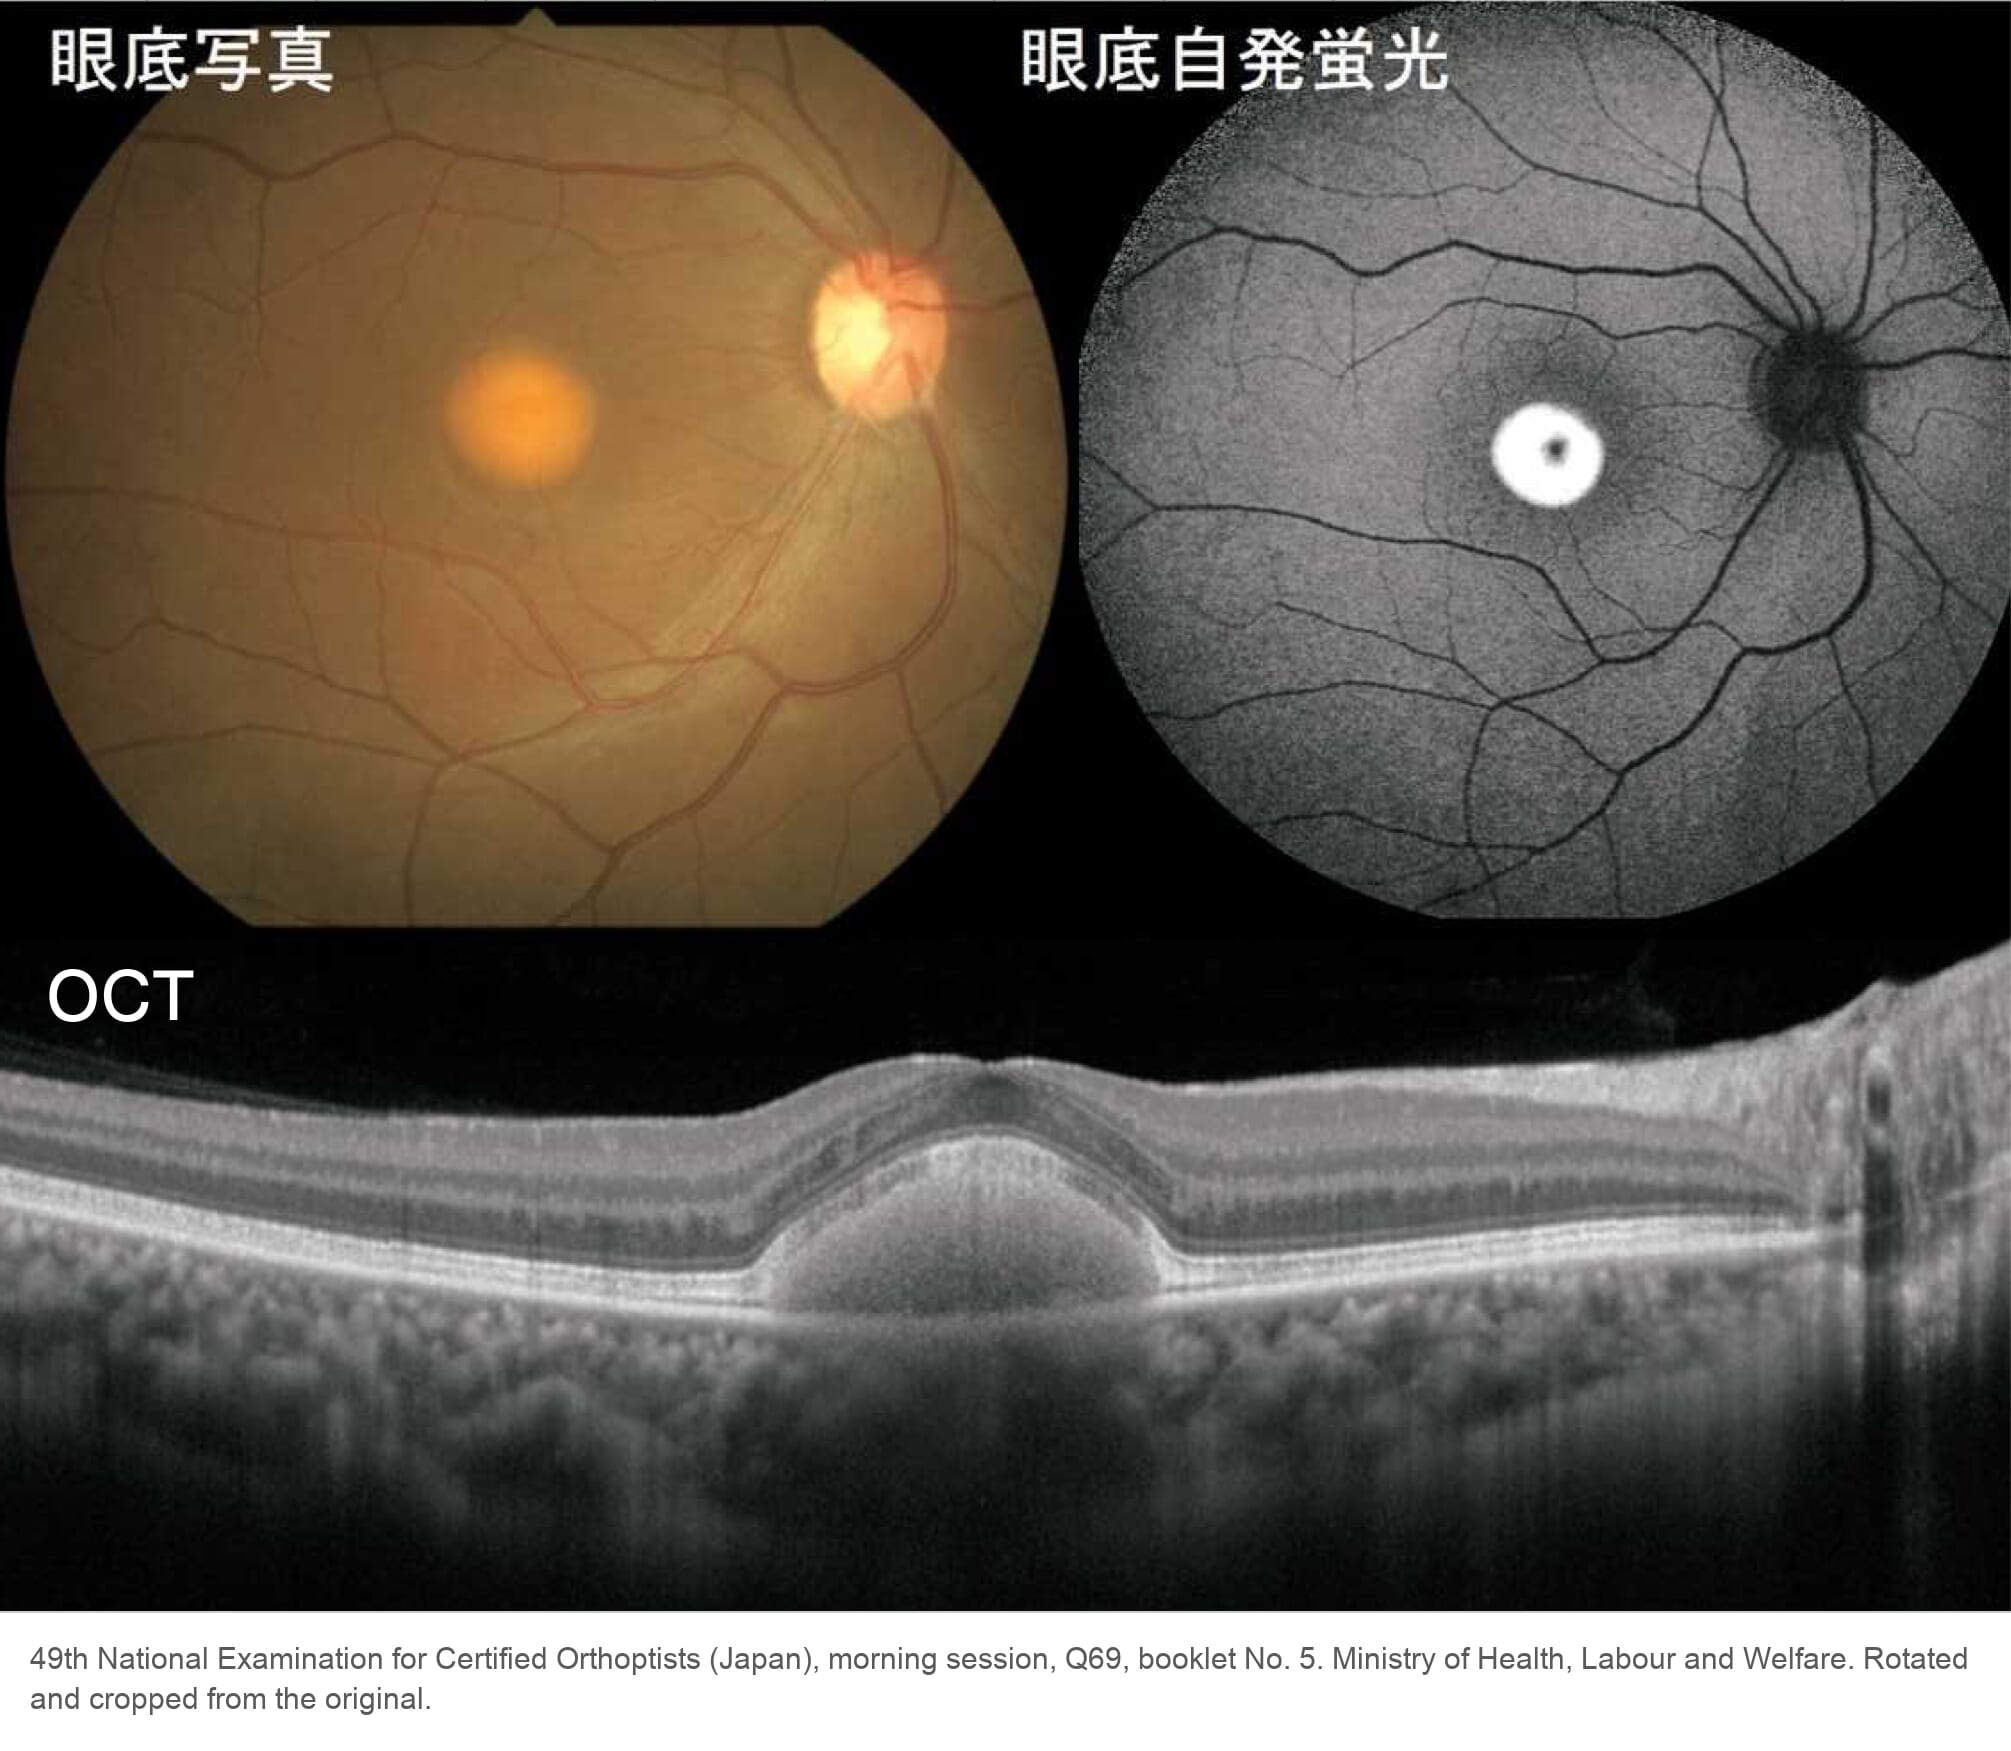
One look-alike to keep apart is central areolar choroidal dystrophy (CACD). Late Best disease, once the yellow material is gone, can leave a well-defined atrophic macula that looks like CACD, but in many cases the EOG of CACD is normal. An abnormal EOG therefore points you toward Best disease rather than CACD.
Two practical points
Look at how the test is performed and one limitation is obvious: the recording depends on the eye movements being normal. If the patient cannot make accurate, repeatable horizontal saccades, the amplitudes are not comparable and the ratio means nothing.
The same electrode arrangement is also used in a different role: recording eye movements themselves, for example to document the waveform of a nystagmus. That use has nothing to do with the LP:DT ratio, but it is why you may see "EOG" attached to a very different kind of trace.
Summary
- The EOG measures the standing potential across the retinal pigment epithelium, not the photoreceptor response.
- The result is the light peak divided by the dark trough: the LP:DT ratio, classically the Arden ratio. Roughly, 2 or above is fine; the normal range of 1.7 to 4.3[1] is wide, so do not call a borderline value on the number alone.
- Widespread RPE disease lowers the ratio, but rarely needs this test to be diagnosed.
- Best disease and autosomal recessive bestrophinopathy are where the EOG matters: abnormal EOG with a normal ERG.
- An unreliable result usually means unreliable eye movements. Check the saccades before you trust the ratio.
References
[1] Constable PA, Bach M, Frishman LJ, Jeffrey BG, Robson AG; International Society for Clinical Electrophysiology of Vision. ISCEV Standard for clinical electro-oculography (2017 update). Documenta Ophthalmologica. 2017;134(1):1–9. PMID 28110380.
Figure credits
The Best disease images are reproduced from the 49th National Examination for Certified Orthoptists (Japan), morning session, question 69, published by the Ministry of Health, Labour and Welfare. Rotated and cropped from the original. The other figures are mine.
Which retinal layer makes which wave, the three abnormal patterns, and the dark-adaptation trap to check before you report “negative” — on one page, by email. One email when I publish something new, about once a month. Unsubscribe anytime.