VEP Test: How to Read a Visual Evoked Potential
What a VEP measures
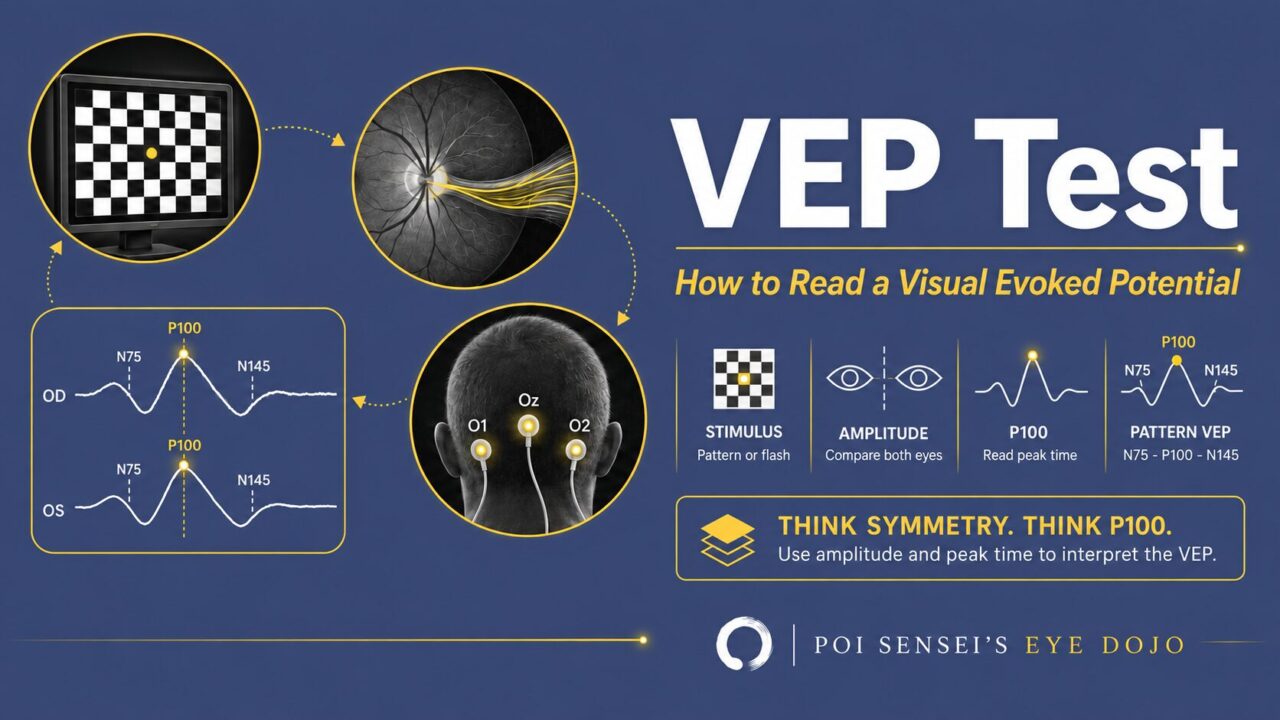
A visual evoked potential (VEP) records the signal produced by the visual cortex in response to a visual stimulus. The electrode sits over the calcarine sulcus at the back of the head, where the center of the visual field is represented. So a VEP is, in practice, a test of the central field and the pathway that serves it.
That makes it an objective test. The patient does not have to say what they see; the cortex answers for them.
Two numbers, two different jobs
A VEP report gives you two measurements: the amplitude of the response, and the peak time of its main component (P100 for a pattern VEP; the components are described below). They are not two views of the same thing. They fall in different diseases, and they have to be compared in different ways.
Amplitude: falls in many diseases, and is read eye against eye
Amplitude falls whenever less signal reaches the cortex, and that can happen anywhere along the pathway. Macular disease reduces it. Amblyopia reduces it. Optic nerve disease reduces it too[1][2]. And so do things that are not disease at all: media opacity, poor refraction, poor fixation, nystagmus. A reduced amplitude tells you the signal is weak. It does not tell you where.
There is a second problem. The absolute value of the amplitude varies widely from one person to the next, and with the recording conditions, so a patient’s amplitude cannot usefully be set against a population value. What you can do is compare the patient’s two eyes. Both pattern and flash VEPs show a high degree of interocular symmetry in normal subjects[3], so a clear asymmetry is a real finding, and it tells you which side is affected.
Peak time: prolonged in optic nerve disease, and readable as an absolute number
Peak time is prolonged when conduction is slowed, and the disease that slows conduction is optic nerve disease. Demyelination in optic neuritis is the classic example, with a well-documented delay of the P100[4].
The reason peak time is so useful is the mirror image of the problem with amplitude. Of the pattern VEP components, P100 shows the least variation between subjects. Because the number is stable between people, it can be compared against the normal range.
Often both numbers are abnormal at once, and that is not a contradiction. The delay tells you where: the nerve. The amplitude tells you how much signal has been lost.
And neither number means anything on a poor recording. Refraction, check size and fixation come before both; more on that below.
The two ways to elicit a VEP
The international standard specifies pattern-reversal, pattern onset/offset and flash protocols. Pattern-reversal and flash are the two you will meet in clinic.
Flash stimulation
This is the same flash used for an ERG, often available on the ERG machine itself, so it comes almost for free when you are already recording one.
The waveform is a V shape, and its amplitude varies even more between people than the pattern VEP does, so, again, compare the patient’s two eyes rather than the absolute value. An asymmetry between the eyes is an objective sign that one side of the pathway is damaged.
Its real advantage is that it works when a pattern VEP does not. A flash VEP can be recorded when a pattern VEP cannot: when vision is too poor to resolve the checks, or when the patient cannot hold fixation, as in small children. It does not need refractive correction either.
Pattern stimulation
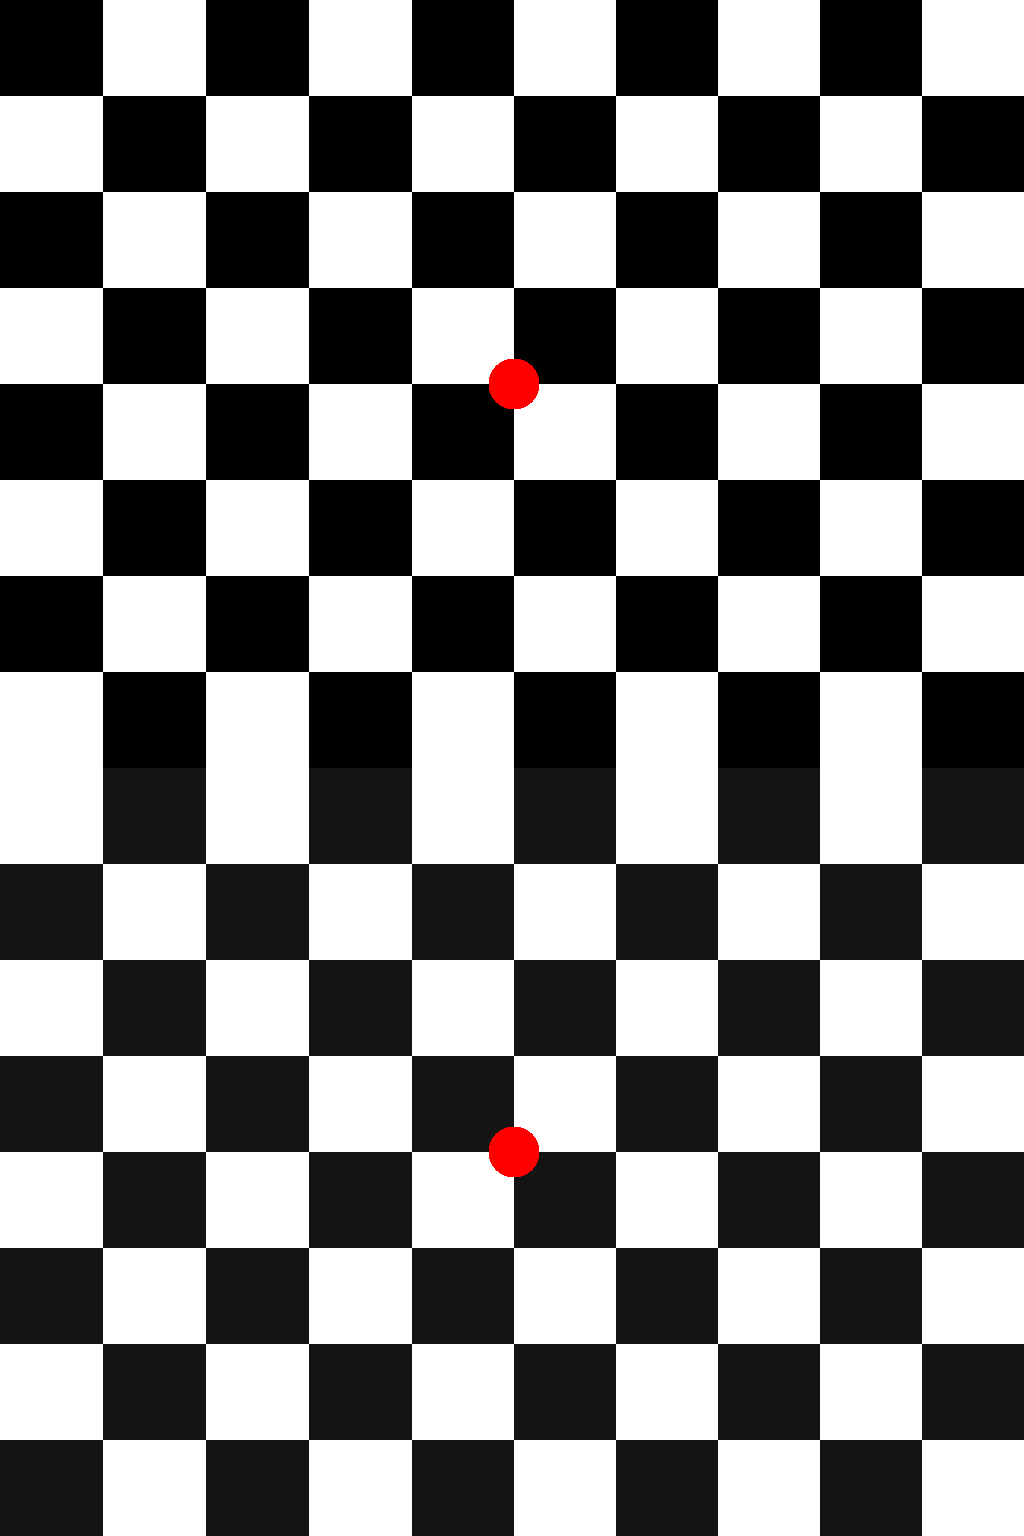
The patient fixates a checkerboard that reverses at a fixed rate.
The waveform has three components, N75, P100 and N145, the numbers being the peak time in milliseconds. Amplitude is measured from the trough of N75 to the peak of P100.
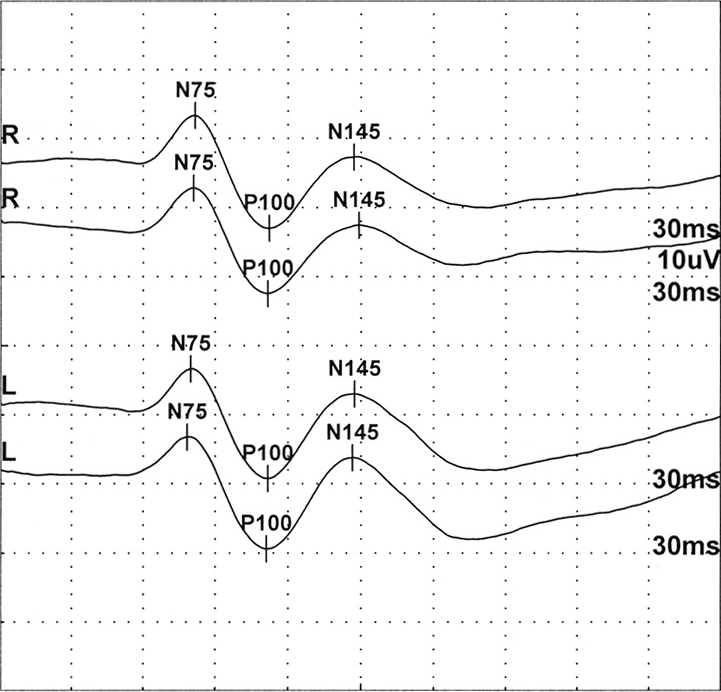
If you learned the third component as N135, that is the older name; the 2025 international standard renamed it N145[3]. Older papers and machine printouts still say N135.
P100 is the component to read. It is the most prominent and robust of the three, and the one of highest clinical importance.
Check size matters, and can be used deliberately. The standard check widths are 1° and 0.25°[3]. If the checks are not resolved clearly, the amplitude falls and the peak time lengthens, so by repeating the recording with different check sizes you can estimate acuity objectively. This is particularly useful in infants and young children, who cannot read a chart; the international extended protocol for VEP acuity estimation was written with them in mind[7]. Refraction has to be corrected properly first, or you will measure the refractive error instead of the visual pathway.
- Compare the amplitude between the two eyes. A clear asymmetry tells you which side is affected. Do not read the absolute value against anyone but the patient.
- Read the P100 peak time against the normal range. A prolonged P100 points at the optic nerve.
- Put the two together. Delayed peak time: optic nerve disease, once the macula has been checked. Reduced amplitude with a normal peak time: the signal is weak somewhere along the pathway, and the history, OCT and pattern ERG decide where.
- Check the recording conditions (refraction, check size, fixation) before believing any abnormal number.
Functional visual loss and amblyopia
This is where an objective test is most useful.
In malingering and in functional (psychogenic) visual loss, the VEP is normal even though the patient reports reduced acuity on subjective testing. The chart says one thing and the cortex says another, and the cortex cannot be coached.
In amblyopia the response is reduced, in proportion to the depth of the amblyopia. So a reduced amplitude does not by itself mean organic disease of the nerve. The history matters.
Reading the waveform
VEP waveforms are hard to read until you have seen a number of them. The discipline that makes them tractable is the one above: amplitude between the two eyes, peak time against the normal range. Then ask the one question that matters most: is the P100 peak time prolonged?
A case worth remembering
I once saw a child referred as suspected functional visual loss. The visual field was somewhat inconsistent on repeat testing, the fundus was normal, and the pupillary responses were normal. Everything pointed away from organic disease.
The VEP showed a prolonged P100 peak time in one eye.
That single finding raised the probability of a real optic neuropathy enough to keep looking, and the child was eventually diagnosed with Leber hereditary optic neuropathy.
When functional visual loss is suspected, run the objective tests and exclude the alternatives before you settle on the diagnosis. That is what they are for.
Summary
- A VEP records the cortical response to a visual stimulus, and reports on the central field.
- Amplitude falls in many diseases (macular, optic nerve, amblyopia) and in poor recording conditions. It varies too much between people to read as an absolute value, so compare it between the two eyes.
- Peak time is prolonged in optic nerve disease. It varies little between people, so read it against the normal range. Macular disease can prolong it too, so check the macula.
- Flash VEP works when a pattern VEP cannot be recorded and needs no refraction, but its amplitude is only interpretable between the patient’s two eyes.
- The VEP is normal in malingering and functional visual loss, and reduced in amblyopia.
References
[1] Jayaraman M, Gandhi RA, Ravi P, Sen P. Multifocal visual evoked potential in optic neuritis, ischemic optic neuropathy and compressive optic neuropathy. Indian Journal of Ophthalmology. 2014;62(3):299–304. PMID 24088641.
[2] Atilla H, Tekeli O, Ornek K, Batioglu F, Elhan AH, Eryilmaz T. Pattern electroretinography and visual evoked potentials in optic nerve diseases. Journal of Clinical Neuroscience. 2006;13(1):55–59. PMID 16410198.
[3] Šuštar Habjan M, Bach M, van Genderen MM, Li S, Mizota A, Nilsson J, Thompson DA, Robson AG. ISCEV standard for clinical visual evoked potentials (2025 update). Documenta Ophthalmologica. 2025;151(2):97–112. PMID 40839165.
[4] Filgueiras TG, Oyamada MK, Hokazono K, Cunha LP, Apóstolos-Pereira SL, Callegaro D, Monteiro MLR. Comparison of visual evoked potentials in patients affected by optic neuritis from multiple sclerosis or neuromyelitis optica spectrum disorder. Journal of Neuro-Ophthalmology. 2022;42(1):e32–e39. PMID 34348361.
[5] Bass SJ, Sherman J, Bodis-Wollner I, Nath S. Visual evoked potentials in macular disease. Investigative Ophthalmology & Visual Science. 1985;26(8):1071–1074. PMID 4019098.
[6] Holder GE. Electrophysiological assessment of optic nerve disease. Eye. 2004;18(11):1133–1143. PMID 15534599.
[7] Hamilton R, Bach M, Heinrich SP, Hoffmann MB, Odom JV, McCulloch DL, Thompson DA. ISCEV extended protocol for VEP methods of estimation of visual acuity. Documenta Ophthalmologica. 2021;142(1):17–24. PMID 32676804.

Which retinal layer makes which wave, the three abnormal patterns, and the dark-adaptation trap to check before you report “negative” — on one page, by email. One email when I publish something new, about once a month. Unsubscribe anytime.