How to Read a Multifocal ERG (mfERG)
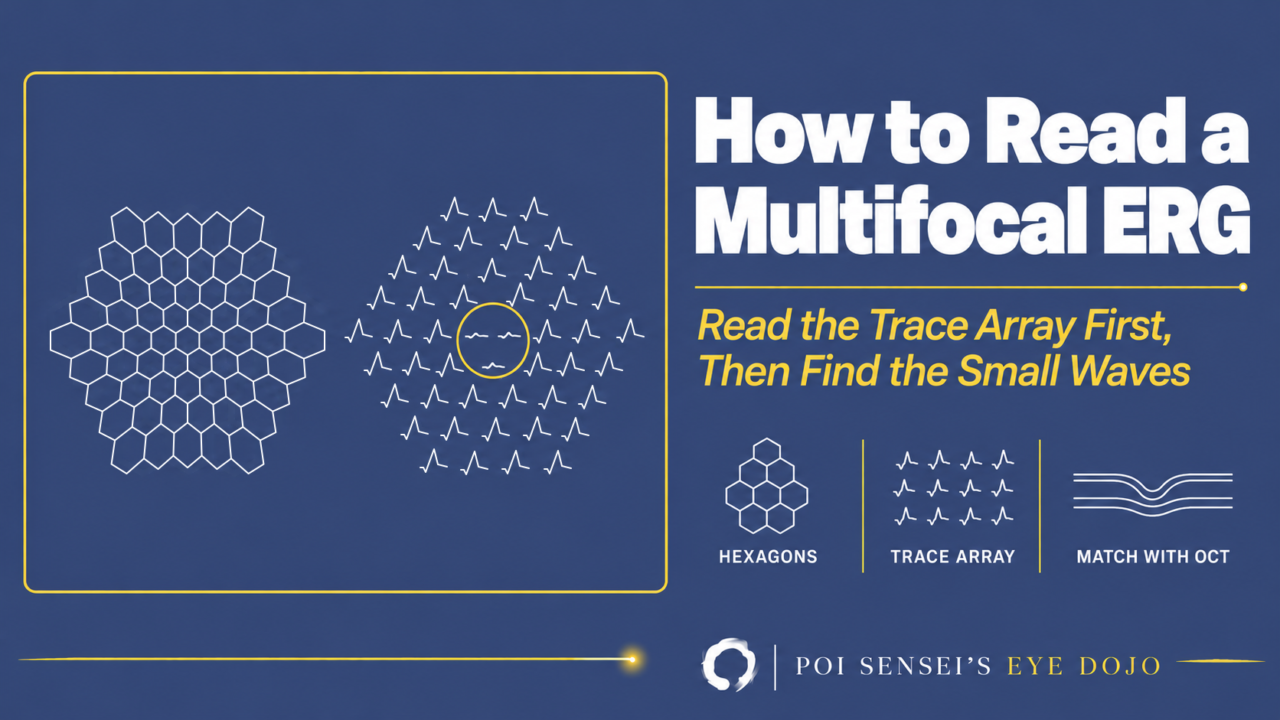
Your patient’s vision is down. The fundus looks normal, and so does the full-field ERG. The multifocal ERG (mfERG) is the test that can find a problem hidden in the macula. This article shows how to read an mfERG report: check the traces, find where the waves are small, and match that area with the OCT and the visual field.
- Check the trace array for quality and artifacts.
- Find where the waves are small.
- Match that area with the OCT and the visual field.
What the mfERG records
The full-field ERG records the response of the whole retina to a flash. The macula is only a small part of the retina, so a disease limited to the macula hardly changes it. To test the macula, you need a test that records many small areas separately.
The mfERG does this. The patient looks at a screen of 61 or 103 hexagons that covers about 40–50° across the center of the retina. Each hexagon flickers between light and dark in its own fixed sequence. A computer then separates the response of each area from one continuous recording. The retina responds less per area toward the edge, so the hexagons are designed to get larger toward the edge. This way, in a healthy eye the responses are about the same size everywhere.
The test is done in light-adapted conditions, so it mainly shows cone function. The signal comes mostly from the cone bipolar cells, with a smaller part from the cones themselves. A disease of the rods alone, such as Oguchi disease, leaves the mfERG normal. The retinal ganglion cells add almost nothing, so optic nerve disease and glaucoma do not reduce it either.
The waveform: N1 and P1
Each local response has a small negative wave (N1), a positive peak (P1) and a second negative wave (N2). The standard measures are the P1 amplitude, from the bottom of N1 to the top of P1, and the P1 peak time, from the flash to the top of P1.
These are not small a- and b-waves. Each response is calculated from the recording, so the names used for the full-field ERG do not apply.
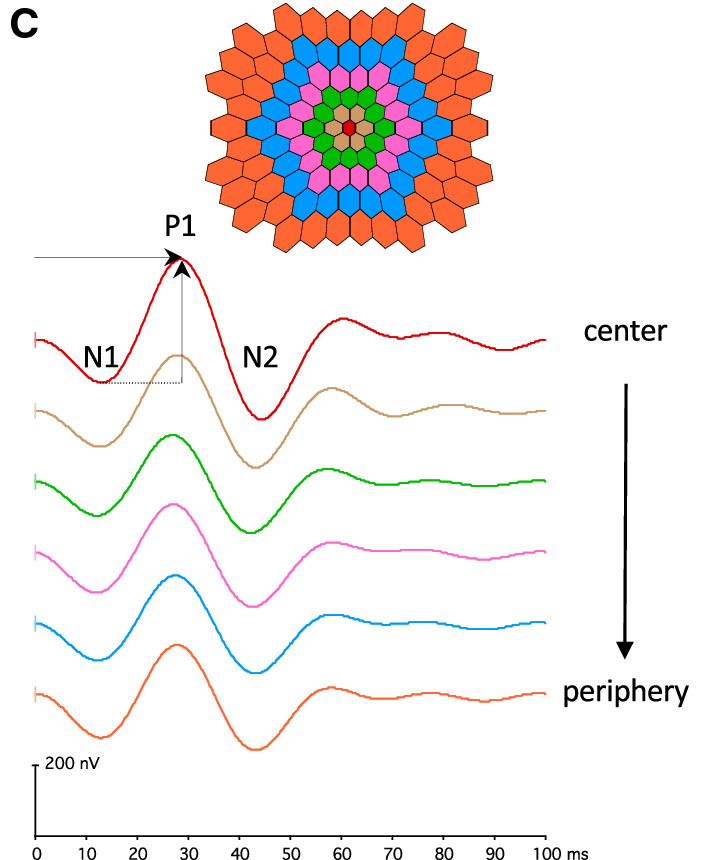
The waveforms run from the center (top) to the periphery (bottom).
Step 1: Check the trace array first
The trace array shows the waveform recorded at each hexagon, placed where that hexagon is. Always look at it before the 3D plot.
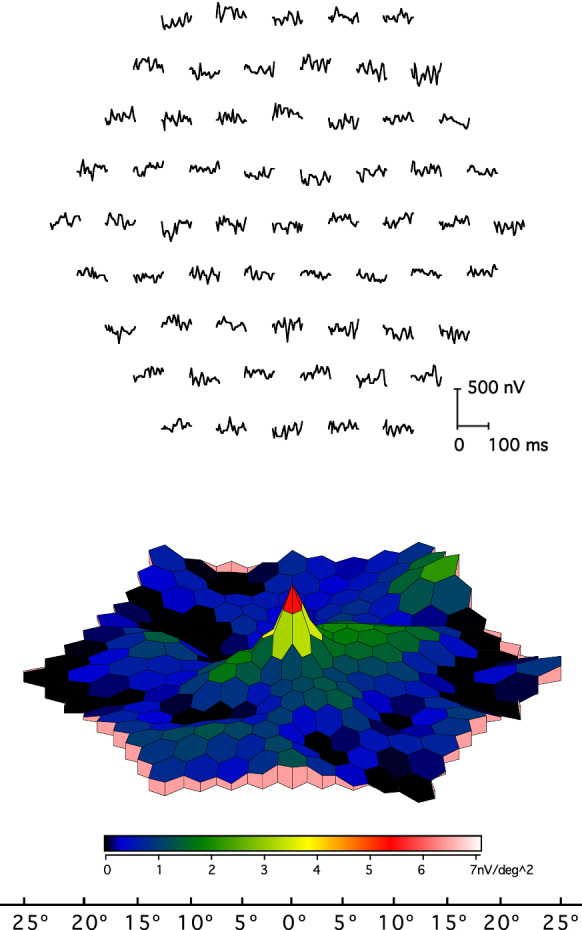
The 3D plot shows the response per area of each hexagon as height. The central hexagon is the smallest. If a hexagon has half the area, the same noise becomes twice as high. So the center can show a peak even when there is no real response.
In the figure below, the screen was switched off during the recording. The trace array has no waves. Still, the 3D plot has a peak in the center. If you look only at the 3D plot, it can look like a normal recording. So be careful not to judge from the 3D plot alone.
Then check the recording itself. Three problems can look like disease. The four figures below are from the same healthy eye. Compare each one with the normal recording.
Normal
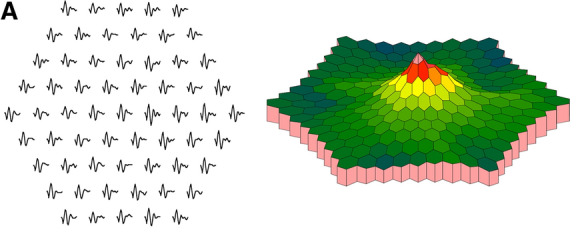
Use this as the reference. The trace array is on the left and the 3D plot on the right. The waves are about the same size everywhere, and the 3D plot has one peak in the center.
Eccentric fixation
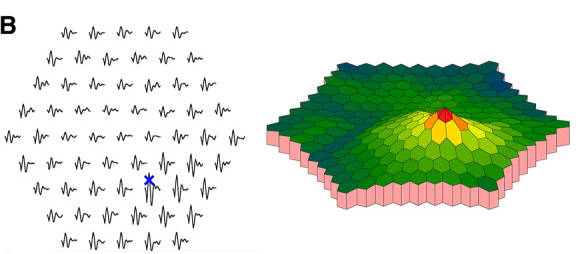
In this figure, the subject was asked to look at the blue cross instead of the center. When the patient looks at a point off the center, the waves are largest where the eye is looking, and the central waves get smaller. The peak of the 3D plot moves off the center.
Unstable fixation
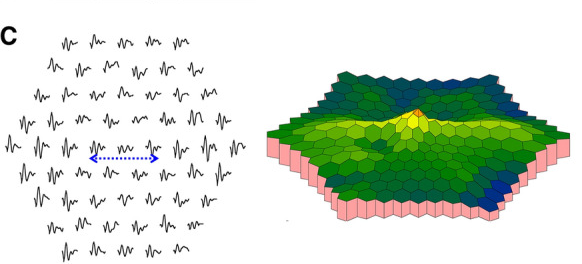
In this figure, the subject was asked to move the gaze along the blue dashed line. When the eye moves during the test, the central waves get smaller, and the waves on either side get larger. The central peak becomes low.
The rim of the trial frame
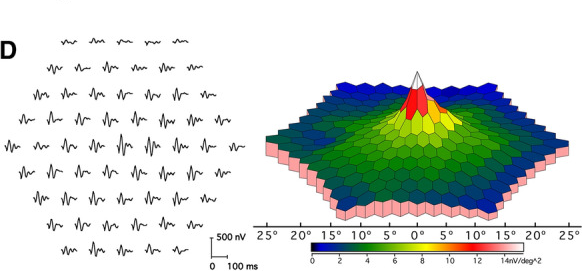
The rim blocks part of the screen and makes a false defect at the edge. Here the waves in the top rows are small.
Step 2: Find where the waves are small
Once the recording is good, you do not need to think hard. If the waves in an area are small, that area is abnormal. Note where the small waves are, how wide the area is and how small they are. Normal values differ between labs because the recording conditions differ. So it is enough to judge roughly whether any area has smaller waves than the rest.
The shape of the small area points to the disease. The figures below are trace arrays in retinal view. Compare each one with the normal recording.
Normal
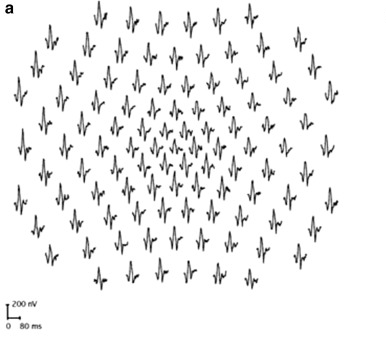
Use this as the reference. The waves are about the same size everywhere.
Small in the center
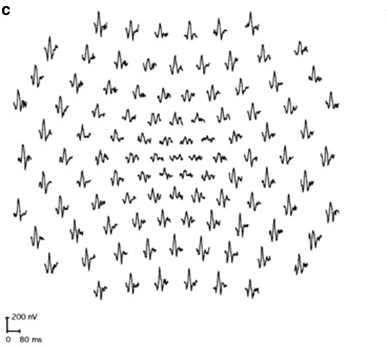
The central waves are small and the outer waves are normal. This is a macular disease, such as a macular dystrophy. In occult macular dystrophy, the fundus and the full-field ERG are normal, and this central loss confirms the diagnosis.
A ring around the center
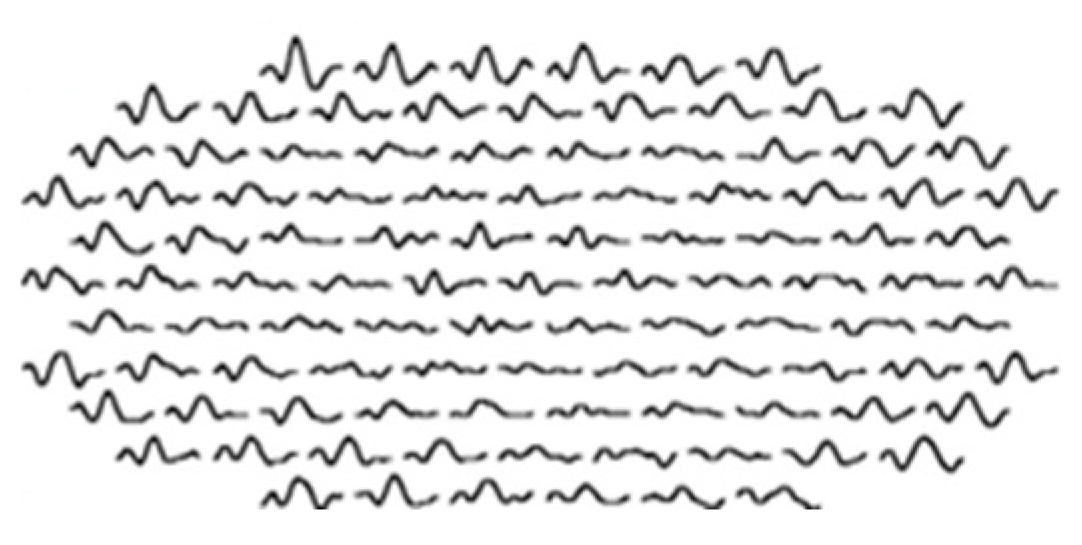
The waves are small in a ring around the fovea. This is the usual early pattern of hydroxychloroquine toxicity in patients of European descent. In East Asian patients, the small waves are often in the outer rings instead. Later the central waves, and then all the waves, become small too.
Spared in the center, small outside
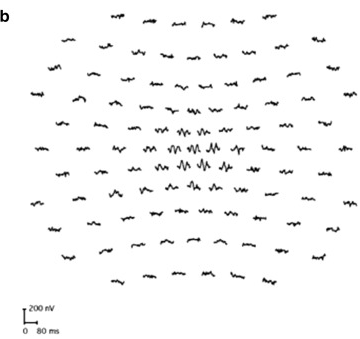
The outer waves are small, and only the central waves remain. This is typical of retinitis pigmentosa, where the macula is spared until late. The full-field ERG is still the main test for RP. The mfERG shows how much central function is left.
A zone, often next to the blind spot
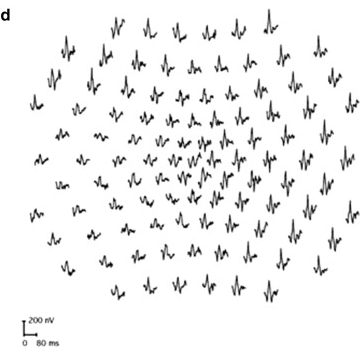
The waves are small in one zone, often around the optic disc. This is seen with an enlarged blind spot and in acute zonal occult outer retinopathy (AZOOR). In AZOOR the full-field ERG is often reduced as well, but it cannot show where the damage is. The mfERG can.
Step 3: Match it with the OCT and the visual field
First check the display: field view lines up with the visual field, retinal view with the fundus and OCT. An mfERG finding is strongest when it fits the structure. In AZOOR, the small waves sit where the OCT shows loss of the ellipsoid zone (the photoreceptor line) and where the visual field is missing. In occult macular dystrophy, the central loss matches a blurred ellipsoid zone at the fovea on OCT. When all three point to the same area, you can be confident the problem is there.
A normal mfERG is useful too. The ganglion cells do not add to the mfERG, so a normal result over a field defect points away from the cones and bipolar cells in that area and toward the optic nerve or beyond. If the VEP is abnormal and the central mfERG is normal, macular disease is unlikely to be the cause.
When to order an mfERG
- Vision is down, but the fundus, angiography and full-field ERG are normal.
- A visual field defect or an enlarged blind spot is not explained by the fundus.
- A field looks like glaucoma but does not quite fit it. Central loss that is too deep for the disc may come from the outer retina.
- The VEP is abnormal and you need to rule out the macula.
- Confirming hydroxychloroquine toxicity when the OCT or autofluorescence is unclear.
The pupils should be fully dilated. Avoid fundus photography and indirect ophthalmoscopy for at least 15 minutes before the test, so plan the mfERG before the photos on the same day.
Summary
- The mfERG maps cone function over about 40–50° across the center, which the full-field ERG cannot do.
- Read the trace array first, because the 3D plot can show a false central peak.
- On a good recording, small waves mean the retina there is abnormal.
- Match that area with the OCT and the visual field.
Which retinal layer makes which wave, the three abnormal patterns, and the dark-adaptation trap to check before you report “negative” — on one page, by email. One email when I publish something new, about once a month. Unsubscribe anytime.