How to Read a Humphrey Visual Field: Four Areas in Order
Do you spend most of your time on the grayscale at the top right? That picture is not for us doctors. It is for showing the patient. A Humphrey printout is crowded with numbers, and it is easy to start in the wrong place. After this article, you will know the right order: the four areas numbered 1 to 4 below, read in the same order every time. It is the order I use in clinic.
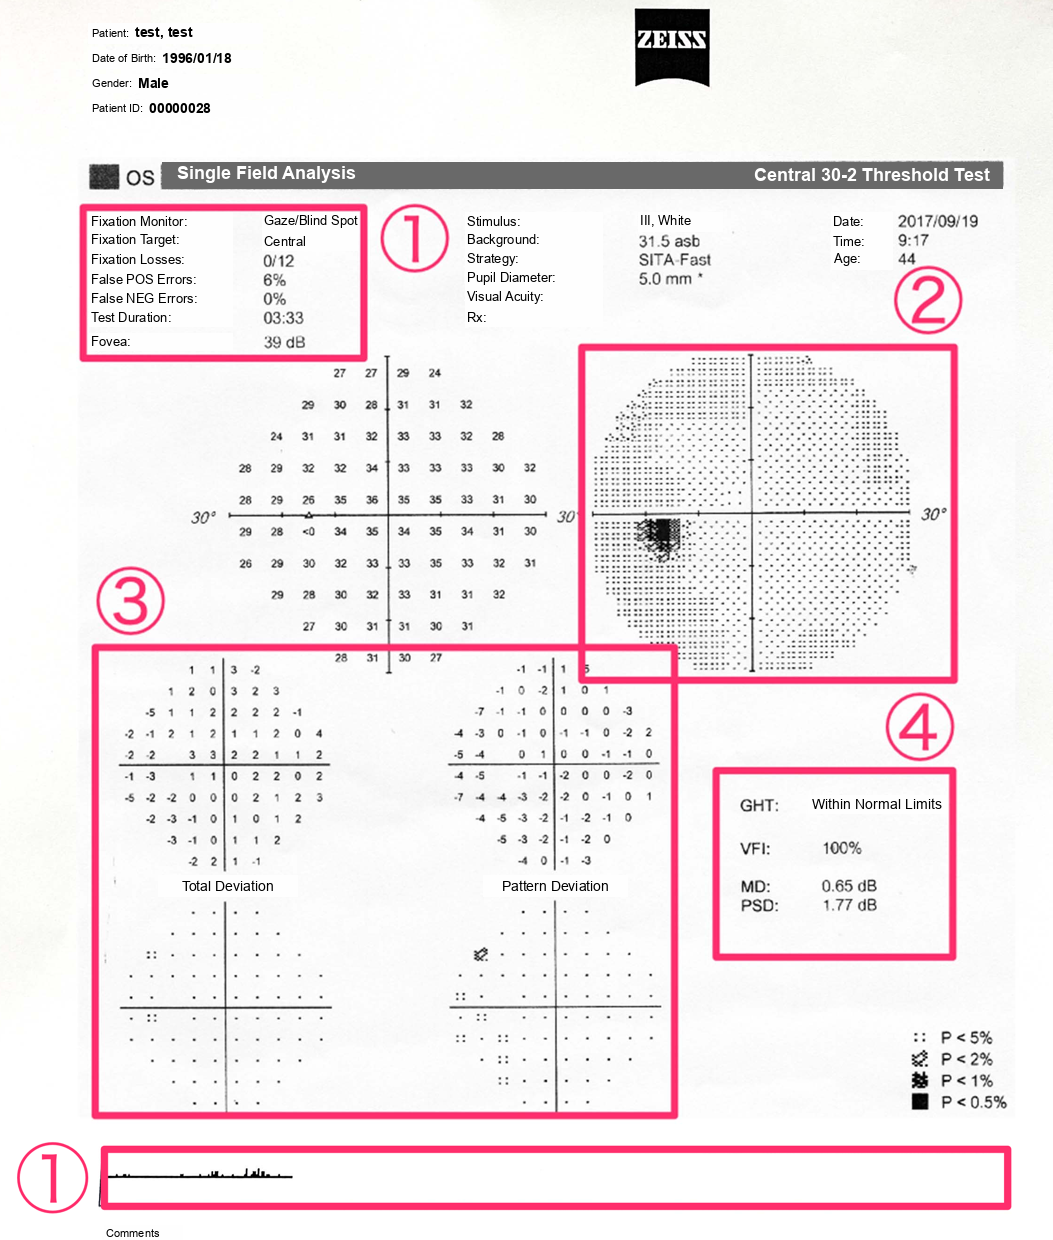
Area 1 is the reliability data at the top left and the gaze tracker along the bottom. Area 2 is the grayscale, area 3 is the total and pattern deviation plots, and area 4 is the global indices with the glaucoma hemifield test (GHT).
1. Reliability: read it first
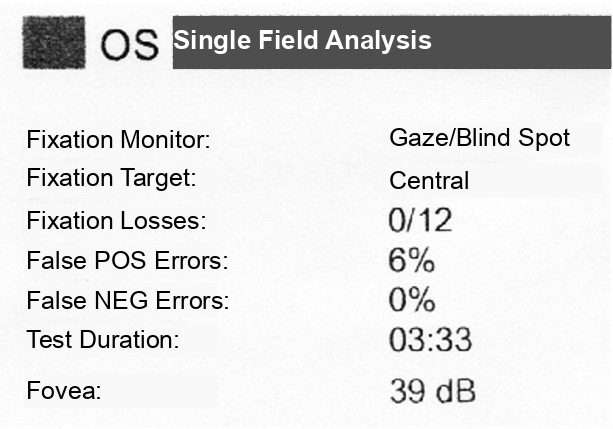
The small print at the top is tempting to skip. Read it first, because it tells you whether the patient did the test properly. A field that looks terrible sometimes only means the patient never understood when to press the button.
- A fixation loss is counted when the patient presses for a light shown in the blind spot. If they saw it, they were probably looking somewhere else.
- A false positive is counted when the patient presses with no light shown, for example on the sound of the machine alone.
- A false negative is counted when the patient does not press for a light much brighter than the threshold already measured at that point.
You do not have to remember the cutoffs, because the printout marks them with XX: fixation losses over 20%, and false positives over 15% with SITA. When you see XX, read the rest with caution and consider repeating the test. The indices themselves are not perfect, though. The gaze tracker along the bottom is a better record of fixation: each upward line shows how far the eye was off target when a light was shown. A flagged field can still carry useful information.
First tests tend to look worse than the real field, because the patient is still learning the test. So take several fields as the baseline.
2. Grayscale: an impression only
The grayscale is only a rough picture of the field, useful for the overall impression and nothing more. So let today be the day you stop grading the field from the grayscale.
It is the best part to show the patient when you explain the result. It also hints at two patterns that come from the patient, not the disease: an unusually pale grayscale goes with many false positives, and a cloverleaf-shaped field goes with many false negatives.
3. Total deviation and pattern deviation: the most important area
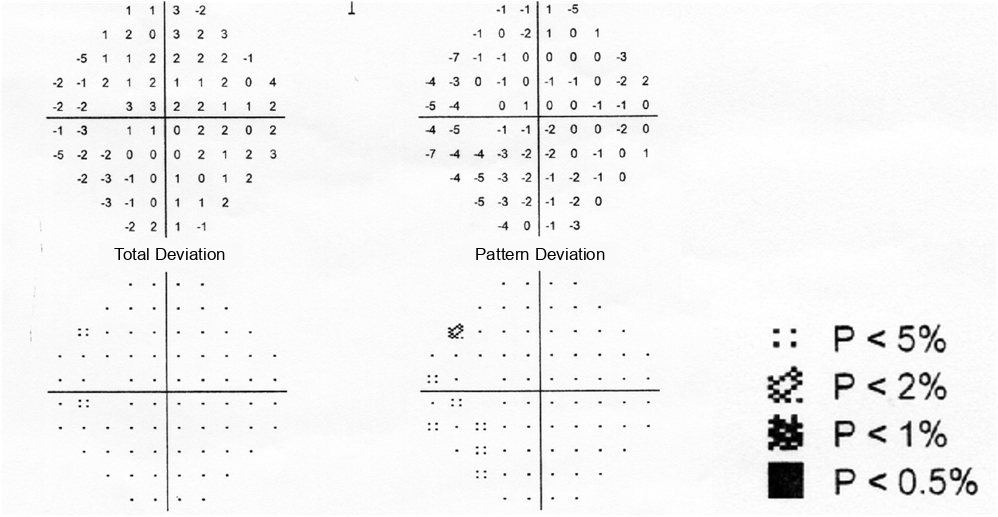
Total deviation compares each point with age-matched normals. In the probability plot below the numbers, the darker the symbol, the more likely the defect at that point is real.
The catch is that anything that dims the whole field, such as a cataract or a corneal opacity, also shows up on total deviation. Pattern deviation removes this general depression and recalculates, so that only the localized defects stand out. In a patient with cataract, the pattern deviation strips away the cataract and leaves the glaucomatous defect.
4. Global indices and the GHT
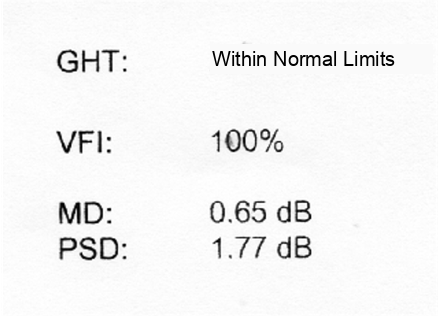
- Mean deviation (MD) is the average of the total deviation: how far the whole field is from normal. It is near 0 dB in a normal field and becomes more negative as the field gets worse.
- Pattern standard deviation (PSD) shows how irregular the field is, so it rises with localized defects.
- Visual field index (VFI) gives the field as a percentage of normal. It weights the central points more and is affected less by cataract than MD.
A p value printed next to MD or PSD means the value is rarely seen in normal eyes.
The GHT compares the upper and lower halves of the field. Glaucoma follows the nerve fiber bundles and is rarely symmetric above and below, so an upper-lower difference points to glaucoma. The result is printed as Within Normal Limits, Borderline or Outside Normal Limits. Because it mainly looks at the difference, a glaucoma that has damaged both halves equally can still come out within normal limits.
Two other messages can appear. "General Reduction of Sensitivity" means the whole field is depressed. Think of cataract or a small pupil before you think of glaucoma. "Abnormally High Sensitivity" usually goes with many false positives.
Is this a glaucomatous field defect?
Read areas 1 to 4, and then check the field against the minimum criteria for a glaucomatous field defect. Any one of these is enough:
- On the pattern deviation plot: three or more adjacent points at p < 5%, not on the edge of the field, and at least one of them at p < 1%
- PSD at p < 5%
- GHT outside normal limits
An abnormal first field is not enough. Repeat it and confirm the defect on two consecutive fields, and read the field together with the optic disc and the nerve fiber layer.
Summary
- Read the printout in the same order: reliability, grayscale, total and pattern deviation, then the global indices and the GHT.
- Check reliability first, and use several fields as the baseline.
- Do not grade the field from the grayscale; use pattern deviation to see past cataract.
- A glaucomatous field defect is a pattern deviation cluster, an abnormal PSD or an abnormal GHT, confirmed on a repeat field.
Following the field over time
Reading one printout is the first step. Following the MD over the years, deciding when the field is getting worse too fast and setting the target pressure are in the glaucoma chapter of my book, Ophthalmology for Your First Year, Volume 1.
Which retinal layer makes which wave, the three abnormal patterns, and the dark-adaptation trap to check before you report “negative” — on one page, by email. One email when I publish something new, about once a month. Unsubscribe anytime.